Instagram Stories have become one of the most powerful ways to connect with your audience, and Instagram Story Analytics help you understand what happens after your Stories go live. Even though Stories disappear after 24 hours, they leave behind important data that shows how people interact with your content.
Understanding this data helps you see what your audience enjoys, what keeps them engaged, and how your content impacts your brand’s visibility. With the right insights, you can make smarter decisions, improve engagement, and create Stories that truly resonate.
In this guide, you’ll learn how to track views for IG, interpret story navigation, and use IG analytics to get the most out of your Stories. By the end, you’ll know exactly what works, what doesn’t, and how to keep your audience coming back for more.
| Key Takeaways ▪ Instagram Story analytics show how people watch, tap, and interact with your Stories, helping you move beyond guesswork. ▪ Story analytics focus on real-time behavior, while feed analytics measure long-term performance when analyzing Instagram grid content. ▪ The most important Story metrics are reach, impressions, and completion rate, as they reveal visibility, repeat views, and attention span. ▪ High reach means more people are seeing your content, while a strong completion rate shows your Stories are holding interest. ▪ To access Story analytics, you must use a Business or Creator account—personal accounts don’t get Insights. |
What Are Instagram Story Analytics?
Instagram Story analytics help you understand how your Stories perform once they go live. Instead of posting and hoping for the best, these insights show you exactly how people interact with your content, what they watch, where they tap, and when they leave.
In simple terms, Story analytics answer questions like:
- Are people actually watching my Stories?
- Do they skip through them quickly?
- Are my Stories interesting enough to hold attention?
Instagram tracks this by measuring views, taps, and interactions, giving you a clear picture of audience behavior.
How Story Analytics Are Different From Feed Analytics?
Stories and feed posts serve different purposes, and their analytics reflect that.
- Stories focus on short, real-time engagement
- Feed posts focus on long-term visibility and discovery
When analyzing Instagram grid performance, you usually look at likes, comments, and saves over time. Stories, however, tell you how people behave in the moment, whether they stay, skip, or exit. Both matter, but they answer very different questions.
Key Metrics You Should Know
Here are the basic metrics that matter most when reviewing Story performance:
- Reach – The number of unique people who saw your Story
- Impressions – The total number of times your Story was viewed
- Completion Rate – The percentage of viewers who watched your Story from the first slide to the last
Why this matters:
- High reach shows strong visibility
- Deep impressions suggest repeat viewing
- A strong completion rate means your content is holding attention
Together, these metrics help you understand what’s working, what’s not, and how to improve your Stories moving forward.
How to Access Instagram Story Analytics
Before you can track how your Stories perform, you need to know where to find the data. Instagram makes this fairly simple, but only if your account is set up the right way.
Tracking your Instagram Story performance helps you understand what content resonates with your audience. Here’s a simple step-by-step guide:
Step 1: Switch to a Professional Account
- To access Story analytics, your account must be a Business or Creator account.
- Personal accounts cannot see Insights.
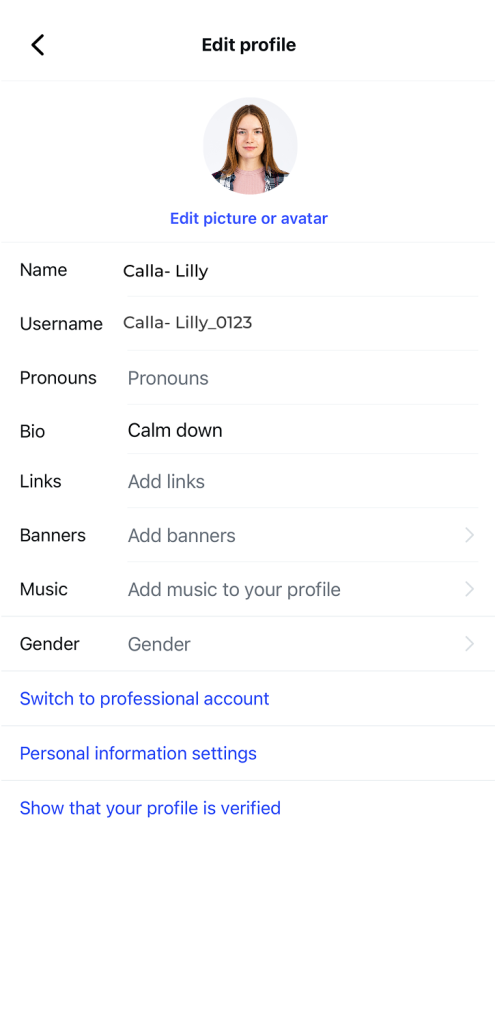
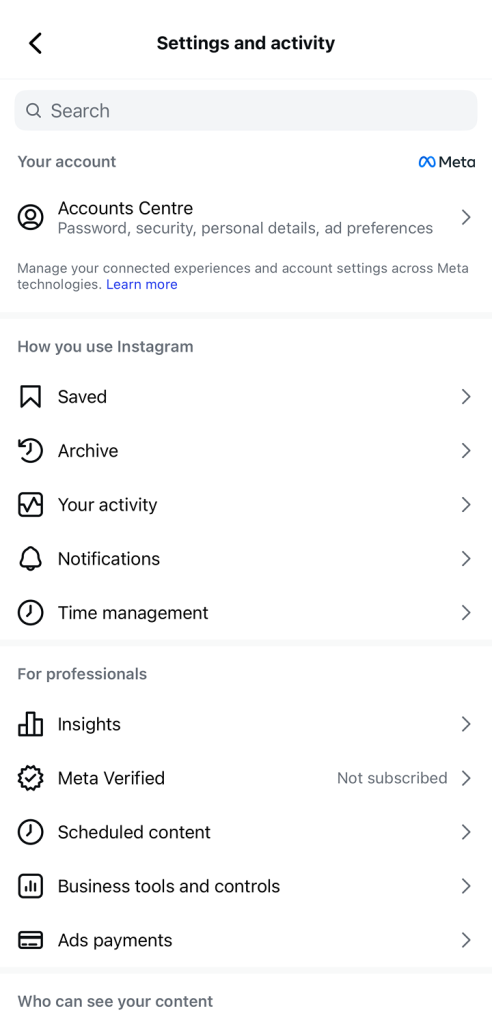
To switch:
- Go to your profile → Settings → Account → Switch to Professional Account
- Follow the prompts and choose Business or Creator.
Once switched, Instagram automatically starts collecting data on all your Stories.
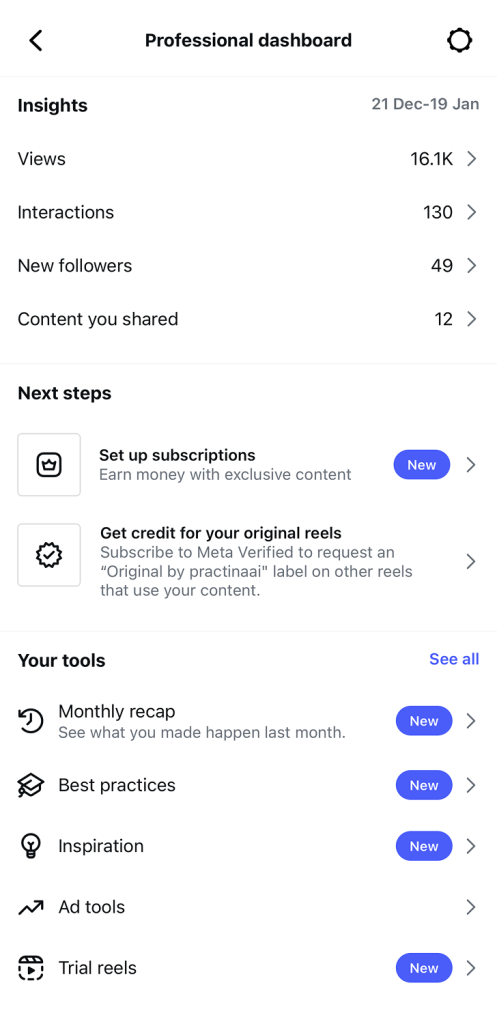
Step 2: Open Instagram Insights
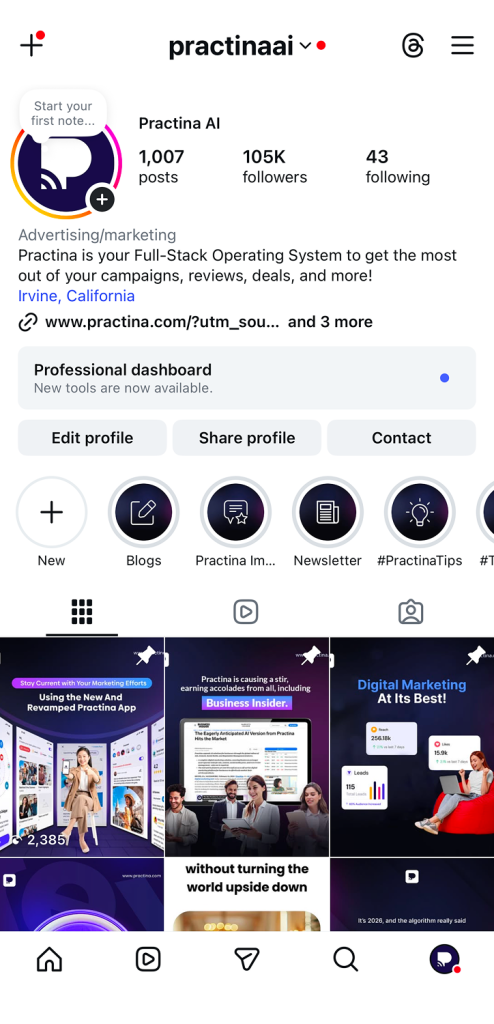
- Similar to analytics for posts and your account, Story analytics can be accessed via the Insights button at the top right of your business profile.
- If you haven’t converted to a professional account yet, follow Step 1 to enable this feature.
Step 3: Navigate to Story Analytics
Once inside Insights, switch to the Content tab at the top.
Here you’ll find analytics for:
- Regular Instagram posts
- Instagram Stories
- Any promotions or ads you’re running
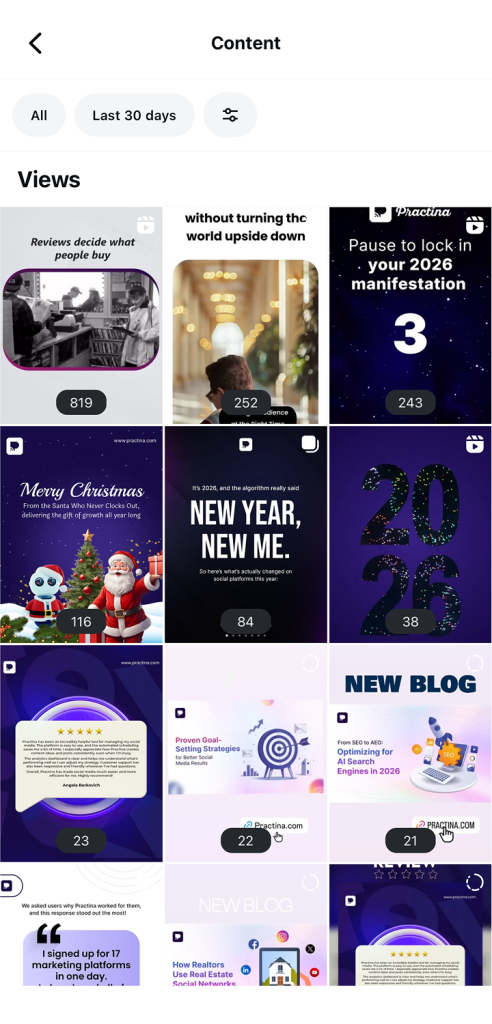
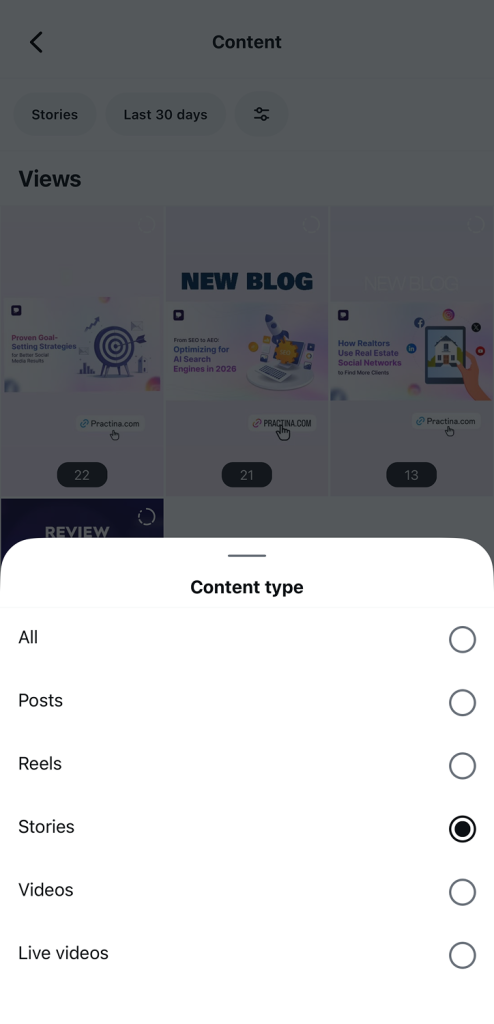
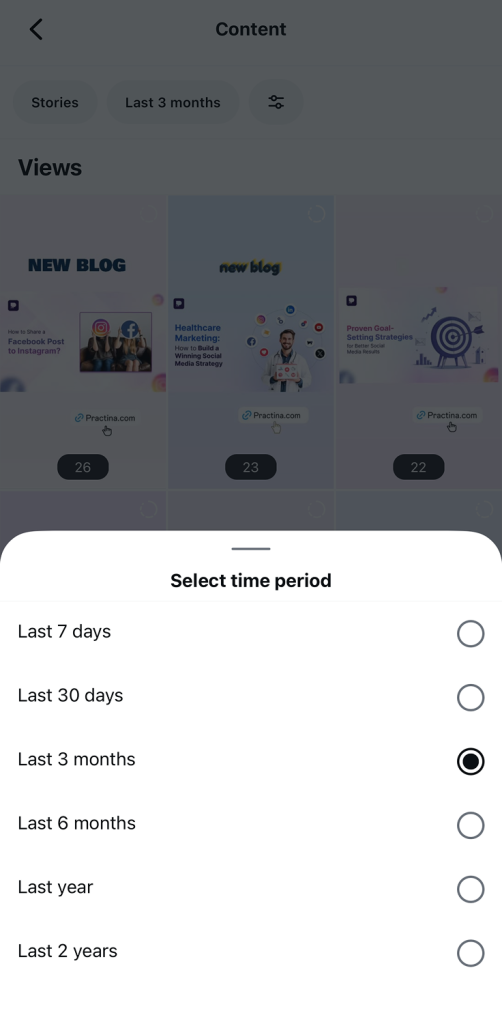
To see all Story metrics:
- Tap See All next to Stories

- You can filter metrics by date range or type of interaction
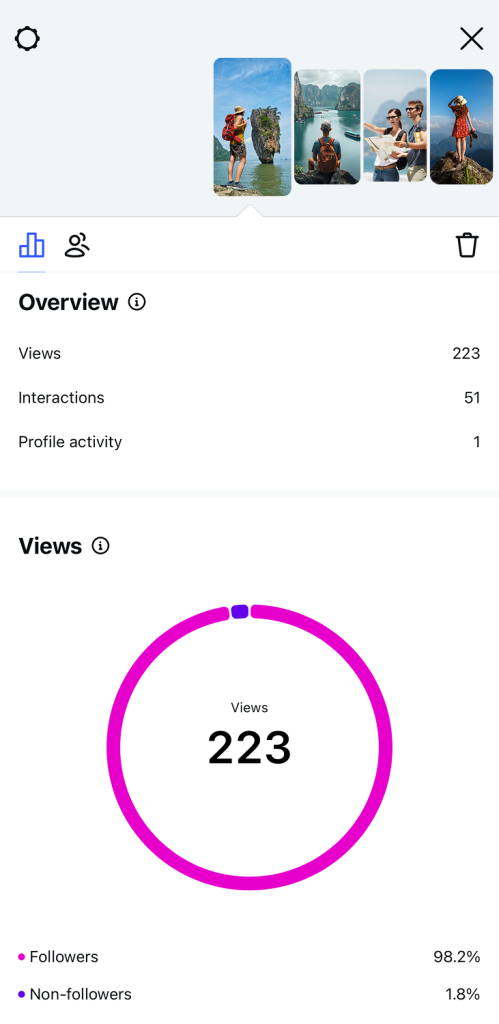
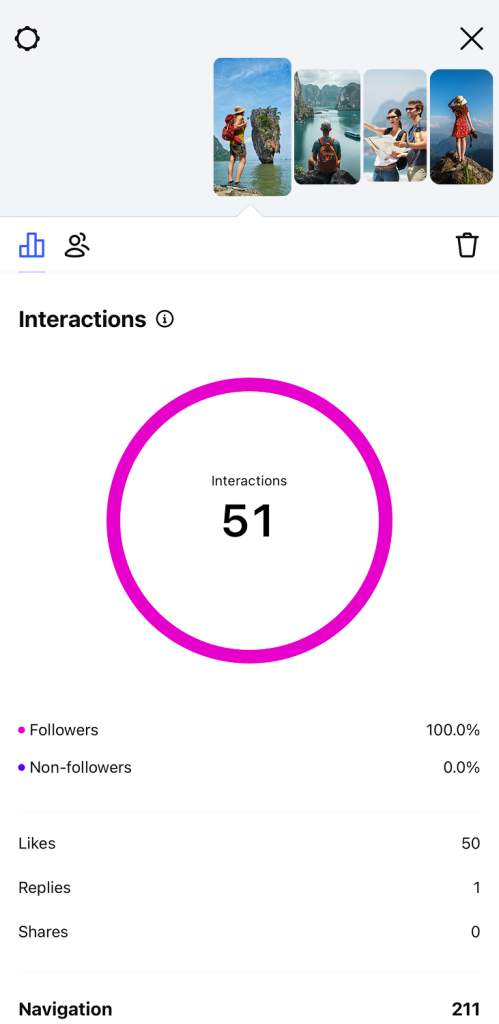
Step 4: Check Analytics on an Active Story (Within 24 Hours)
- While your Story is live:
- Open your Story
- Swipe up on the screen
- You’ll see metrics such as:
- Views – Number of people who watched
- Reach – Number of unique accounts that saw it
- Interactions – Replies, sticker taps, link clicks, profile visits, and more
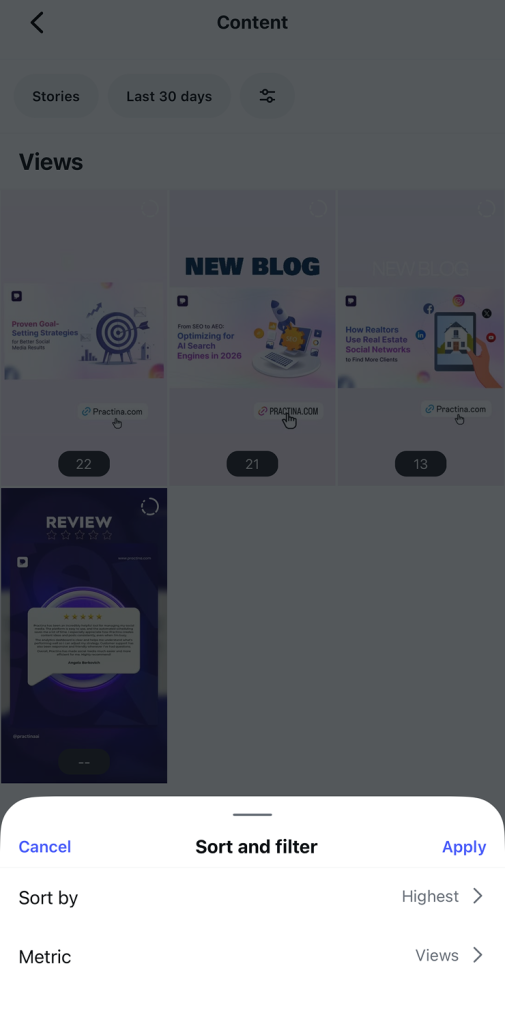
Step 5: View Analytics After a Story Disappears (After 24 Hours)
- Even after a Story expires, Instagram keeps the data for you to review.
- To access it:
- Go to your profile → Insights → Content → Stories
- Go to your profile → Insights → Content → Stories
- Here you can:
- Compare past Stories
- Filter by metrics or date
- Spot trends and see what type of content performs best
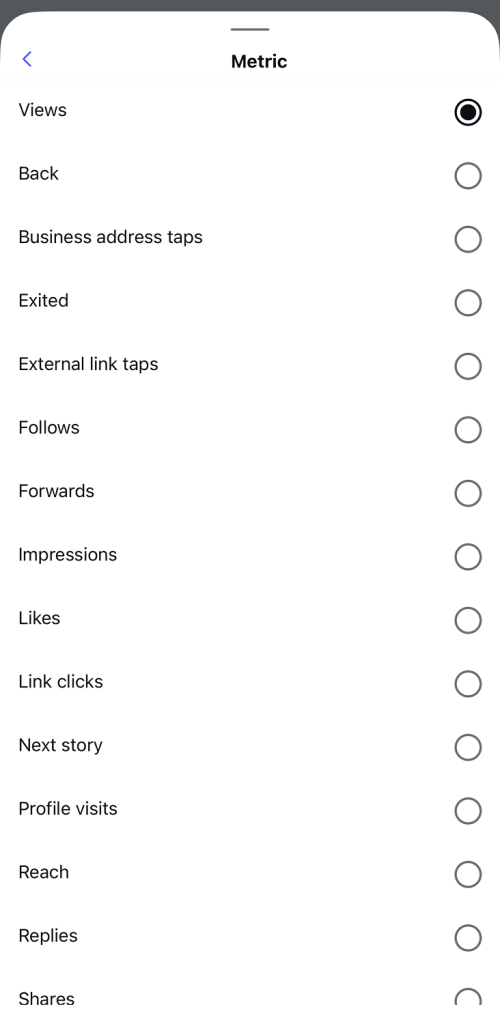
Step 6: Analyze Your Story Metrics
- Completion Rate: See how many people watched all frames of your Story.
- Interactions: Check link clicks, sticker taps, replies, and profile visits to measure engagement.
- Audience Insights: Know your audience’s age, gender, location, and active hours.
- Content Testing: Compare videos, images, polls, and quizzes to see what works best.
Step 7: Use Analytics to Improve Future Stories
- Focus on high-performing content and repeat the type of Stories your audience likes.
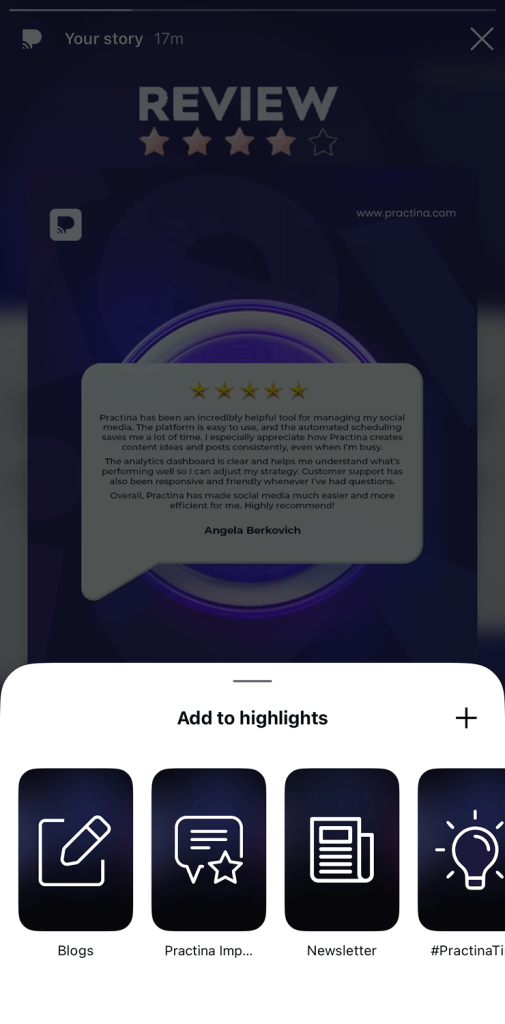
- Save top Stories as Highlights to extend engagement.
- Regularly review metrics to adapt and optimize your Instagram Story strategy.
Understanding the Dashboard and Instagram Navigation
Inside Insights, Instagram organizes data in a simple layout. You’ll see numbers for views, taps, and exits, along with visual indicators that show audience behavior. Learning how to move through this dashboard is part of understanding overall Instagram navigation, and it helps you quickly find the metrics that matter most.
Once you know where to look, checking Story analytics becomes a habit—not a chore, and that’s when the data actually starts helping you improve your content.
Key Metrics to Track: Instagram Story Views and Performance
Views for IG / Instagram Story Views
Views are usually the first metric people look at, but they are also one of the most misunderstood. If you only focus on the number, you miss the real story behind it.
Here’s what you need to know:
- Total Views show how many times your Story was watched overall
- Unique Viewers show how many individual people saw it
Why this matters:
If total views are much higher than unique viewers, it means some people are watching your Story more than once. That’s a strong signal that your content is catching attention.
Impressions vs Reach
These two metrics work together and should never be looked at in isolation:
- Impressions count every time your Story appears on someone’s screen
- Reach counts how many unique accounts saw your Story
When reviewing Instagram Story Views, this comparison helps you understand whether people are just seeing your content or actually coming back to it.
| Quick overview: If the reach is high but impressions are low, your Story may not be engaging enough to rewatch. If impressions are strong, you’re doing something right & your content is worth a second look. Tracking views for IG the right way helps you move from surface-level numbers to real performance insights. |
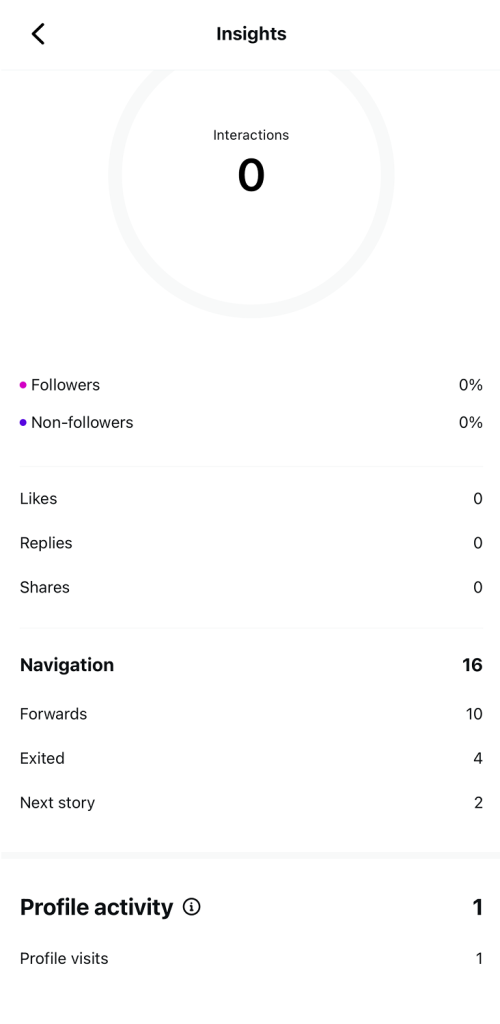
Story Navigation Metrics
Story navigation metrics show how people move through your Stories, not just whether they see them. These actions reveal intent like interest, boredom, or curiosity, and they are some of the most valuable signals for improving engagement.
Here’s what each navigation metric means and how to read it correctly:
- Forward Taps
This happens when a viewer taps to skip to the next slide. What does forward mean on an Instagram story? It shows the content was too slow or was being quickly scanned. A high number can mean your opening needs more punch. - Back Taps
Back taps occur when someone taps to go back and rewatch the previous slide. This is a positive signal. It often means the viewer found something interesting, important, or worth reading again. - Next Story
This action means the viewer swiped away from your Story to watch another account’s Story. Frequent next-story actions can indicate your content failed to hold attention early. - Exits
Exits show when someone leaves Stories entirely. This is the strongest signal of lost interest and usually points to weak hooks, long slides, or unclear messaging.
Why Story Navigation Matters
Story navigation tells you how engaged your audience really is. Views only show exposure, but navigation shows behavior. When you understand these patterns, you can improve pacing, tighten your message, and design Stories that keep people watching instead of skipping.
Tracking story navigation consistently helps you turn viewer behavior into a smarter engagement strategy, slide by slide.
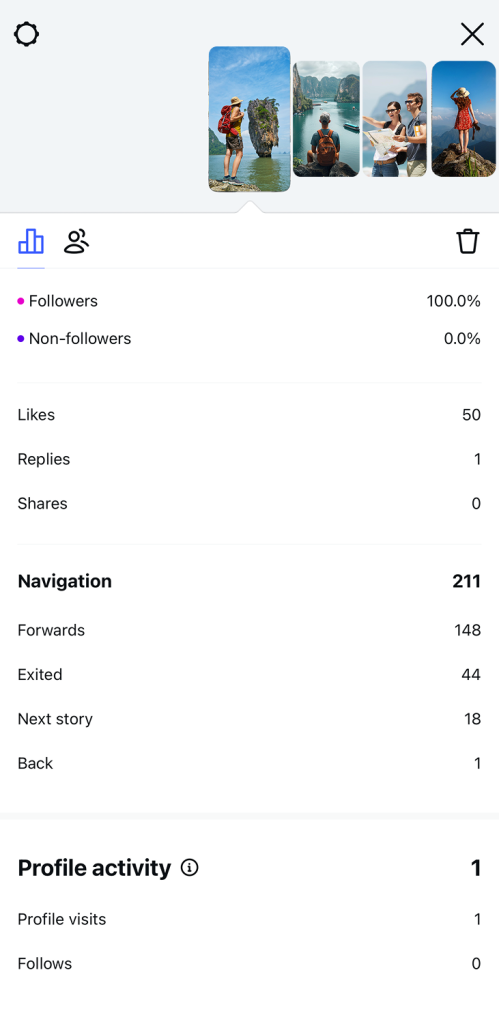
Engagement Metrics
Engagement metrics show what happens after someone watches your Story. These actions matter because they signal real interest, not passive viewing. When people engage, it means your content moved them to take the next step.
Here are the key engagement actions to track:
- Replies
Replies are one of the strongest indicators of engagement. When someone sends a message from your Story, it shows your content sparked curiosity, emotion, or a question worth responding to. - Shares
Shares indicate value. If viewers share your Story with others, it means they found it useful, relatable, or worth sharing. - Link Clicks
Link clicks show intent. Whether you’re driving traffic to a website, product page, or resource, this metric tells you how effective your call-to-action really is. - Profile Visits
Profile visits show interest. While Instagram Stories don’t reveal individual viewers, this metric tells you how many tapped your profile after watching.
Why Engagement Metrics Matter
Views tell you who saw your content. Engagement tells you who cares.
High engagement means your message is clear, relevant, and valuable to your audience. Low engagement is a sign to adjust your message, visuals, or call-to-action.
When you track engagement consistently, you stop guessing and start creating Stories that actually drive action.
Start tracking the Story metrics that actually drive engagement
Master Instagram Story analytics in minutes
Try PractinaPrivacy & Visibility Questions
When it comes to Instagram Stories, a lot of users are curious about what other people can see and what Instagram actually tracks. Here’s the truth behind some common questions:
- Can you see who views your Instagram Story?
Yes, Instagram does show you who has viewed your Story, but only while the Story is active (within 24 hours). After it disappears, you can still see insights like total views, but you cannot track individual viewers anymore. - Can you see who screenshots your instagram story?
No. Instagram does not notify you or track if someone takes a screenshot of your Story. This means you won’t know who saved your content.
Analyzing Instagram Grid vs Stories
Instagram Stories and feed posts work together to give your audience a complete experience. Understanding how they complement each other can help you boost overall engagement.
- How Stories Complement Your Grid
Stories provide real-time, short-term engagement, while your feed posts show long-term content that stays on your profile. By using both, you can guide viewers from casual Story watchers to loyal followers who interact with your posts. - Tips for Combining Stories and Grid Content
- Share sneak peeks or behind-the-scenes content in Stories that link to your main feed posts.
- Use Stories to highlight new feed content and drive profile visits.
- Align the style and messaging of Stories and feed posts to create a consistent brand experience.
- Share sneak peeks or behind-the-scenes content in Stories that link to your main feed posts.
By strategically combining Stories with your Instagram grid, you can increase both reach and engagement, keeping your audience interested and active.
Tips to Optimize Your Instagram Stories Strategy
Creating Instagram Stories that truly engage your audience requires planning and strategy. Here are five actionable tips to get the most out of your Stories:
- Start with Strong Hooks
The first few seconds of your Story are critical. Use eye-catching visuals, bold text, or intriguing questions to grab attention. Strong hooks reduce forwards and exits, keeping viewers engaged. - Post at the Right Time
Share your Stories when your followers are most active. Posting at peak times increases views, engagement, and the chance people will return to watch more of your content. - Keep Your Stories Short and Clear
Avoid long slides or cluttered visuals. Short, concise Stories are easier to watch and more likely to be completed, improving your completion rate. - Use Insights to Improve Your Content
Regularly review your Story metrics—views, taps, exits, and engagement. Identify which types of content work best and replicate those strategies to boost reach and engagement. - Encourage Interaction
Add polls, quizzes, question stickers, or call-to-action prompts. These increase engagement, drive profile visits, and make your Stories more memorable.
Conclusion
By tracking views, understanding story navigation, and monitoring engagement, you can see what works, what doesn’t, and how to improve every Story you post.
Using these metrics wisely lets you craft Stories that keep viewers watching, interacting, and coming back for more. If you want to take your Instagram strategy even further, platforms like Practina can help you analyze performance, schedule content, and optimize engagement effortlessly.
Use these insights to create high-performing Instagram Stories that drive results.
FAQs
Q: What Does “Forward” Mean on an Instagram Story?
A: A forward tap means someone skipped to the next Story slide quickly.
For businesses, too many forwards show your content may be slow or not engaging enough.
Q: Can You See Who Views Your Instagram Story?
A: Yes, you can see who viewed your Story while it is live for 24 hours. After that, Instagram only shows total view numbers, not individual names.
Q: How to See Profile Views on Instagram from Stories?
A: Instagram does not show exactly who visited your profile. You can only see the total number of profile visits from Story analytics.
Q: Can You See Who Screenshots Your Instagram Story?
A: No, Instagram does not notify you when someone takes a screenshot. This applies to both personal and business accounts.